An aspect of water level of significance to the ecology of the marsh is how water, soil, and sediment interact at Kawai Nui. What does the daily water level record say about saturation of the soils and maintenance of open bodies of water on the marsh? This question is far more complex than might first appear. Kawai Nui is a layered system (see description under geology), and much of it can be described as a shallow lake covered by a floating mat of vegetation. However, this description is an over-simplification. A discussion of water/solids interactions in Kawai Nui is presented elsewhere.
Note that the latest graph (4th quarter 2002) includes rainfall as a bar graph (vertical blue lines) along the bottom. The scale (y-axis) is read as inches for these measurements from a manually read rain gage located near the top of Na Pohaku. From inclusion of these measurements it can be seen how rainfall clearly influences water level.
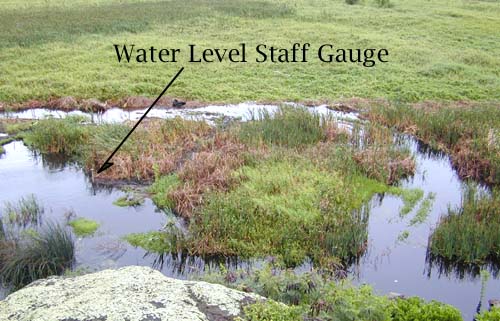
Sharp or sudden rises in water level always correspond to heavy rainfall periods. Rainfall is monitored at Na Pohaku o Hauwahine; however, the water level of the marsh is mostly dependent upon rainfall in the wetter, upper watershed (Maunawili Valley). We expect that local runoff will elevate the water level around the staff gauge (located on a pond with a restricted connection to the remainder of the marsh) within a period of hours or less. Then, a rise in the water level of the marsh generally will occur after a longer period of time, as rainfall in Maunawili Valley drains via streams into the marsh. The difference between the local effect and the general water level rise are not seen in these data, in part because water level is not recorded continuously. The point is, that the rainfall induced peaks cannot be interpreted as representing water level across the entire 800+ acre wetland.
With a decline in rainfall into the dry season, the marsh is seen to gradually lose water. After a small, but sharp rise in water level resulting from an unseasonable rainfall on July 29-30 (2.25 inches at Na Pohaku), the water level in the marsh declined steadily at an average rate of -0.009 ft (-2.8 mm) per day through October 14. Change in water level results from the balance between stream, spring, and runoff inflows (+) and water loss due to outflow and evaporation (-).

The graph to the left compares staff gauge readings made at Na Pohaku o Hauwahine with the nearest reading (readings are reported every 15 minutes) at USGS Gauge No. 16264600 in Kawai Nui Marsh at the south end of the levy. Several sudden changes in water level readings during this period call into question the calibration of the instrument. However, the dry season pattern of water level changes follows the Na Pohaku o Hauwahine readings reasonably closely, at least until the end of August when the USGS gauge appears to get hung up (water level remained constant for most of September). During this period of comparison, there was only one rainfall event resulting in a clear rise in the water level at Na Pohaku o Hauwahine (that of July 30-31). A distinct water level rise was also recorded at the USGS gauge, but with a peak on August 3. This lag is thought to be a reflection of either the local vs. general water level change between Na Pohaku and the marsh as a whole, or the time it takes for an incoming wave of water to peak downstream from Na Pohaku, or some combination of these effects.